
I recently studied the daily load curves of Delhi, which have been available on delhisldc.org/loadcurve since January 1, 2019. Some of the notable points were:
- There is a remarkable consistency in these curves from one day to the next, as long as there in no rain or any sudden change in weather.
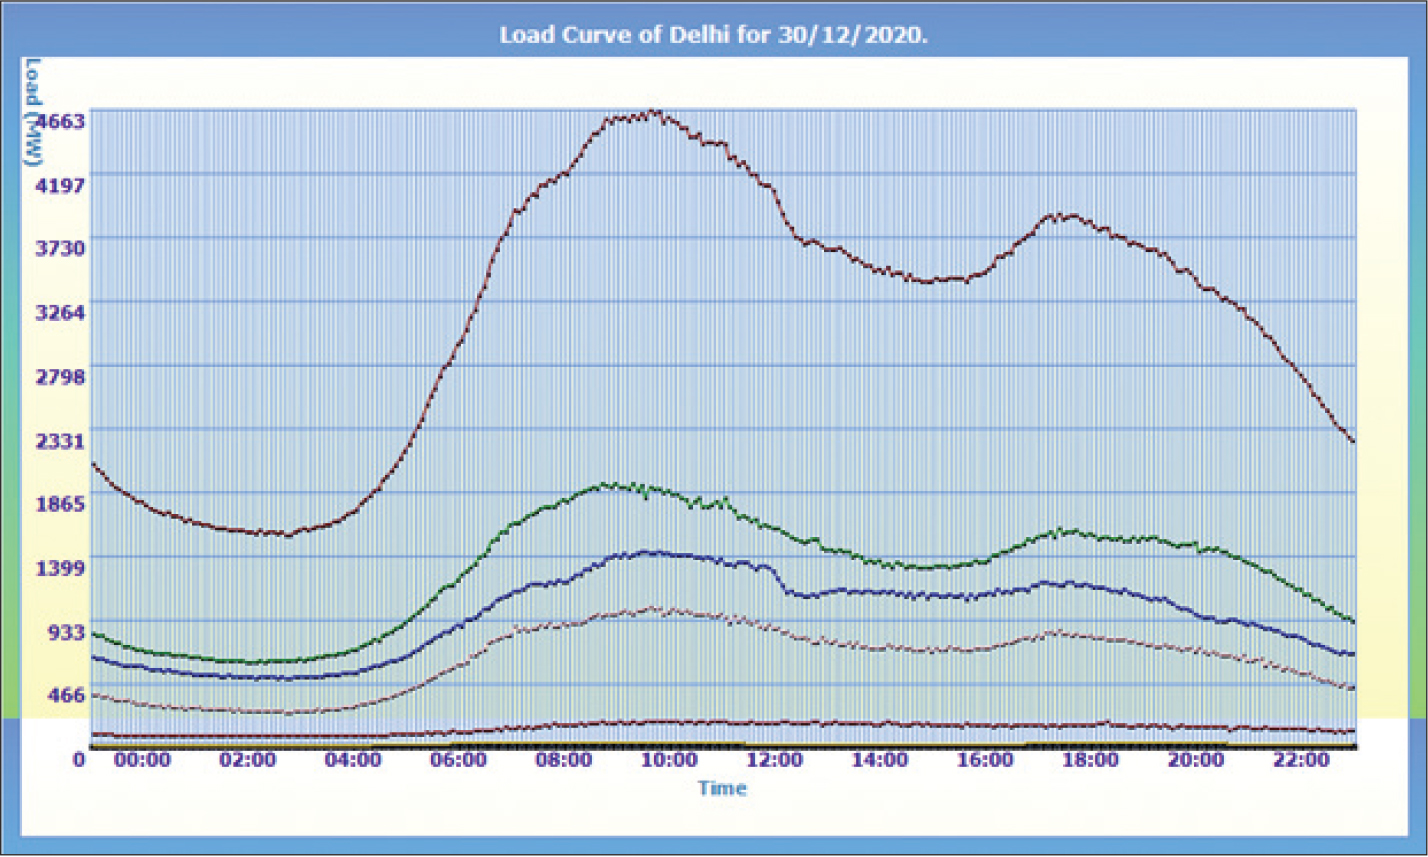
- The attached load curve for December 30, 2020 is a fairly good representative of the winter months (mid-November to mid-March). The daily peak invariably occurs at around 9.30 a.m., and the load is at its lowest level (less than 50 per cent of the peak load) between 1 a.m. and 4 a.m. There is a distinct evening peak at around 6 p.m., generally about 80 per cent of the morning peak. While the megawatts may vary from one day to another, the general shape of the curve remains substantially the same for these four months.
 There is a large ramping up of load between 4.30 a.m. and 9 am. On many days, there is a much faster ramp-up between 4.30 a.m. and 6 a.m. The evening ramp-up between 4 p.m. and 6 p.m. is insignificant in comparison.
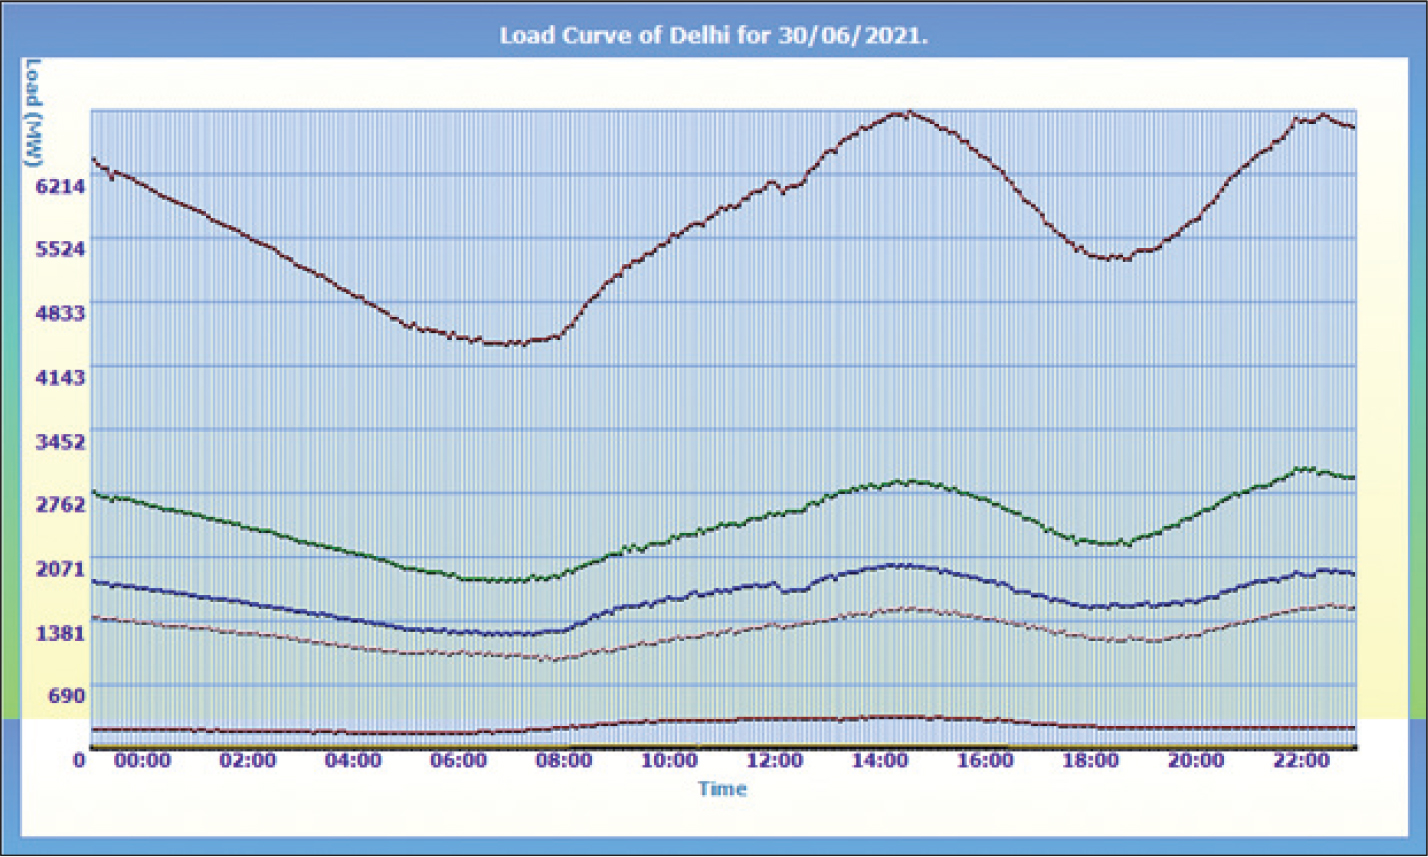
- The attached load curve for June 30, 2021 is a good representative of no-rain days during the summer months (May to September). The daily peak invariably occurs at around 2.30 p.m. and/or at around 10.30 p.m., and the load is at its minimum level between 5 a.m. and 7 a.m. The evening load, at 6 p.m., is about 80 per cent of the two peaks. There is no morning peak and the morning ramp-up is more gradual. There is no pre-evening ramp-up.
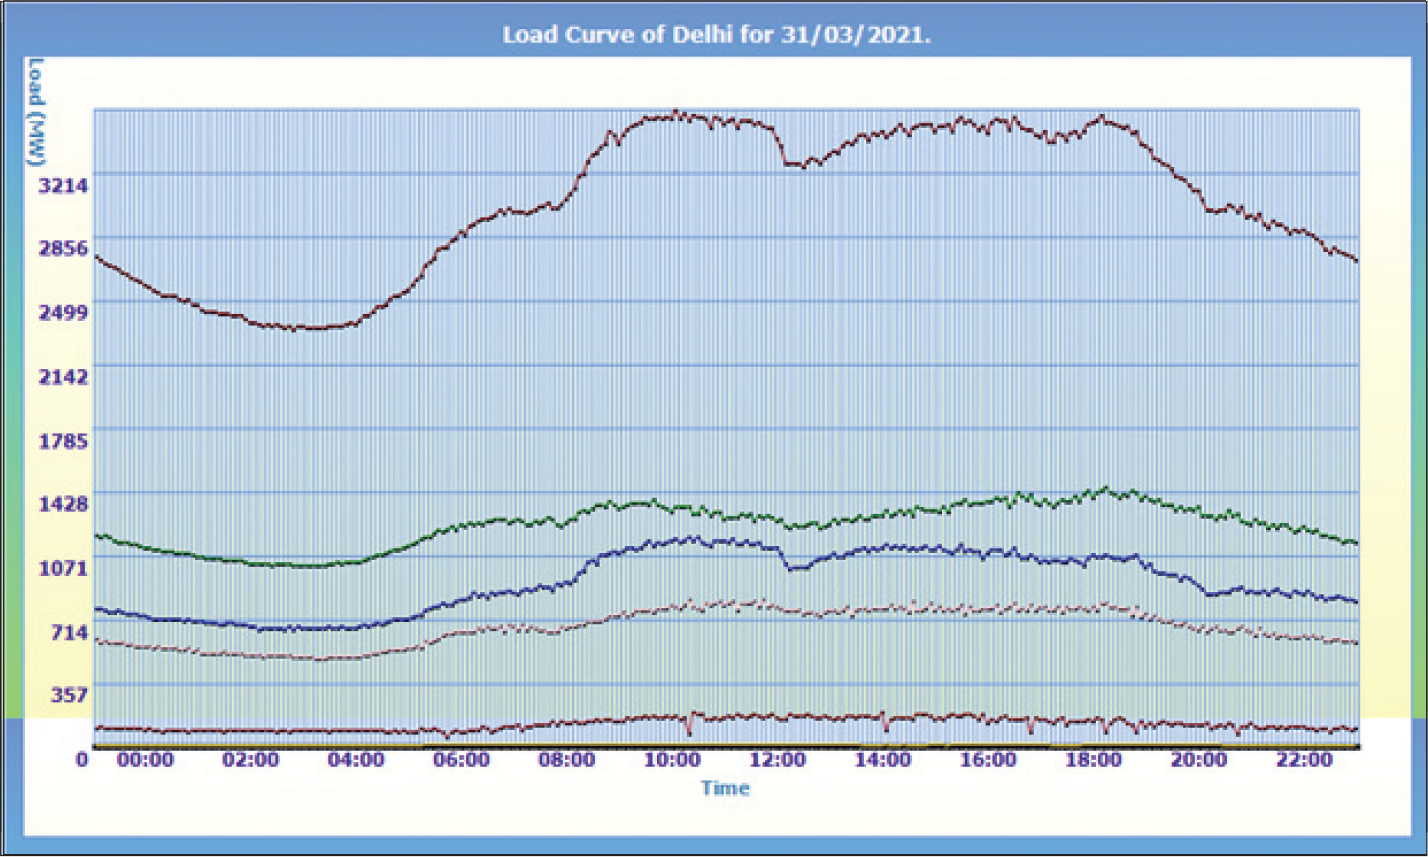
 During the spring period (mid-March to April end), the morning peak gradually comes down, and the night load gradually rises. The attached load curve for March 31, 2021 illustrates this transition from winter to summer.
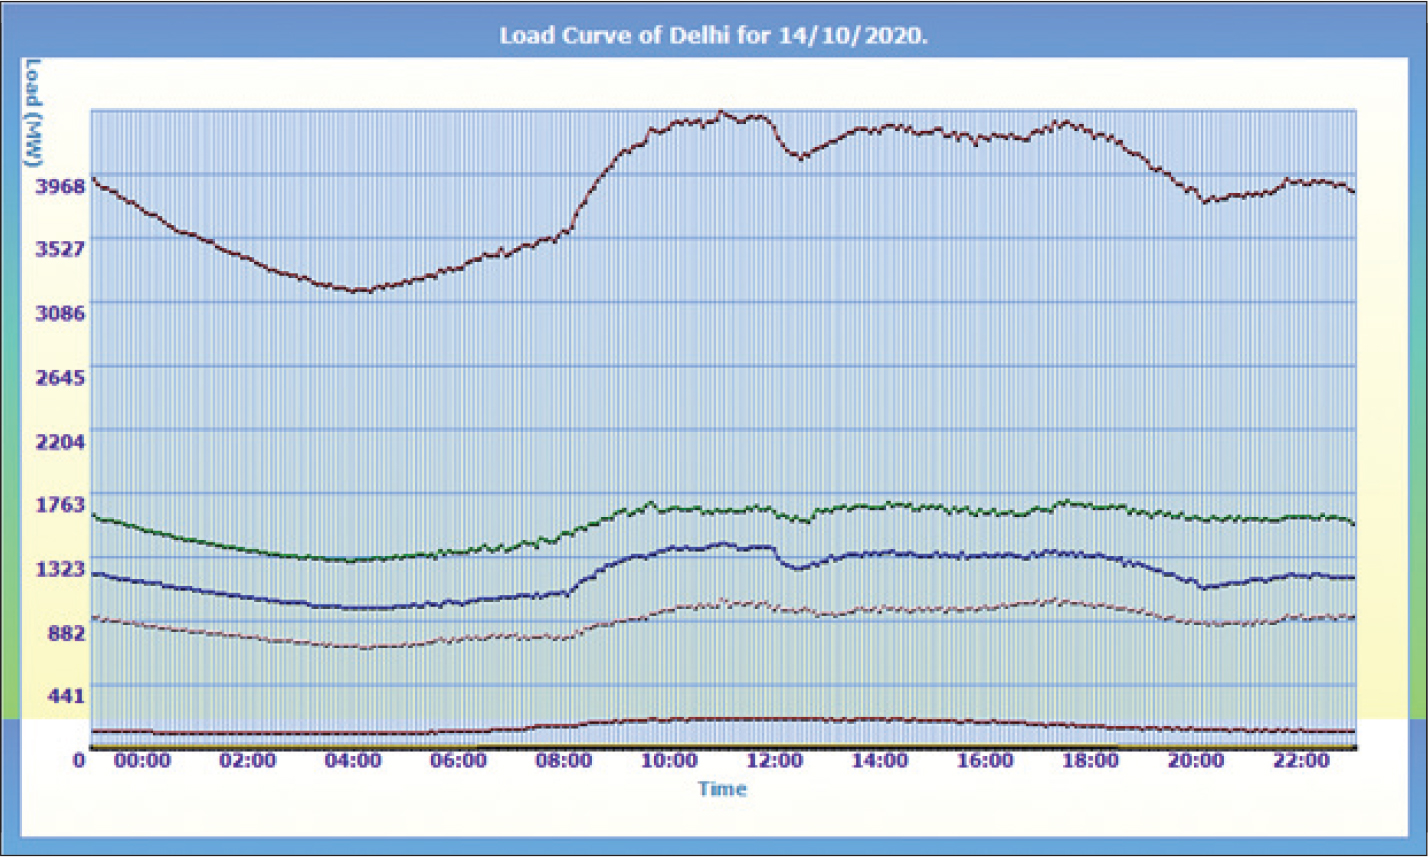
- The reverse happens during the autumn period (October beginning to mid-November) when afternoon and night loads come down and the morning load rises. The attached load curve for October 14, 2020 illustrates this transition, during which the load is more or less constant from 10 a.m. to 6 p.m.
The following conclusions may be drawn from the foregoing observations:
- During the winter months, domestic water heaters and room heaters in offices are largely responsible for the high morning and pre-noon load and for the fast ramp-up every morning.
 During the summer months, air conditioning in offices and commercial complexes is the main cause for the afternoon peak, and domestic air conditioning is the major factor behind the peak load at around 10.30 p.m.
- The replacement of incandescent lamps with CFL and LED lights has brought down the evening load. At one time, it was taken for granted that the system load will invariably peak during the evening hours. This is no longer the case.
- There is a major difference in the daily load curve patterns of summer and winter, which may require special planning for adequate sourcing of power.
The reasons why a close study of Delhi’s daily load curves is important
Delhi must have adequate power supply in order to be free from load shedding, rostering and curtailment. Delhi’s load curve may therefore be taken as the natural load curve of its residents.
 Delhi is a megapolis, and can indicate the direction in which the other cities would grow and towns would follow through urbanisation and general prosperity. The load curves of Delhi, therefore, show the direction in which the all-India load curve may move. This is very important for planning various aspects of the Indian power system for the future such as:
- The “peak” and “off-peak” hours for time-of-day tariff and metering. Should they not be different for summer and winter months?
- The requirement of retaining conventional power plants in an operational state even when substantial renewable capacity has been commissioned.
 The requirement of backing down and the two-shifting mode of operation of thermal plants, as also keeping them on hot/cold reserve for prolonged periods; and how to tackle the technical and commercial problems arising from the above.
- Requirement and siting of battery storage systems.
- Timing of charging electric vehicles.
- Timing of planned rostering of power supply for agriculture, if resorted to.
For a historical perspective, the load curve of January 2009 is shown in the last figure. Its comparison with Delhi’s present load curves will show how things are changing.
By Bhanu Bhushan, Former Member, Central Electricity Regulatory Commission