

Meter data is a storehouse of valuable information for any distribution utility. Consumer data can be precisely recorded through a smart meter and used through the medium of data analytics for myriad purposes, including predicting the load curve of consumers, detecting power theft, enhancing supply quality, augmenting supply reliability and providing better customer service.
Meter data acquisition
It is critical to acquire data from a meter while ensuring its integrity and making it available in a cost-effective manner for last mile analysis. Meter data acquisition systems can be split into two broad categories: field devices and services; and software, hardware and services. Field devices and services primarily comprise electricity meters and communication systems, while the other category comprises head end systems, meter data management systems and enterprise applications (including billing, open metering systems, demand response and analytics).
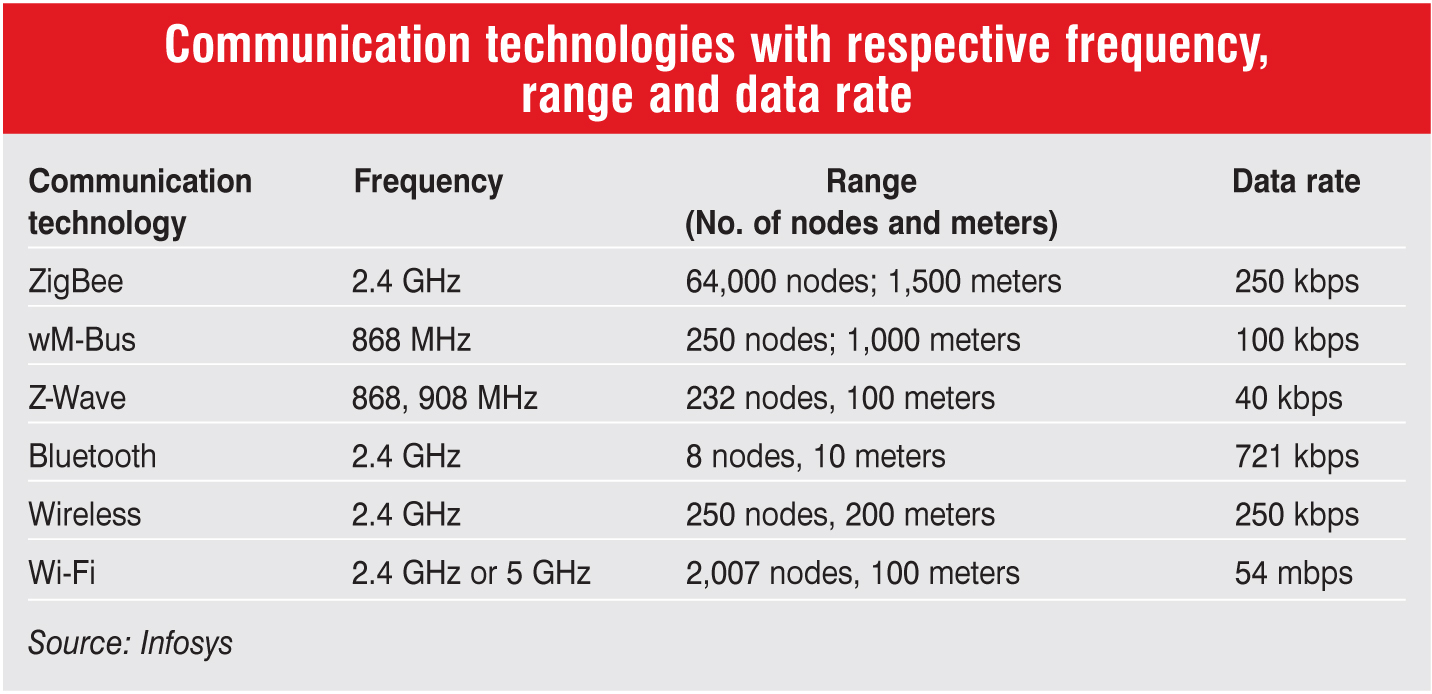
Various technologies can be used for acquiring data from smart meters, and utilities can choose to adopt different methods in different pockets of its distribution area. The key considerations that must be kept in mind are the communication range, which depends on the area’s geography and type of consumers; the cost of the communication technology, including the cost of meters, operations and maintenance, etc.; maintaining the integrity of data; the interoperability of the technology to avoid dependence on a particular vendor; compatibility with existing infrastructure; and the scalability of the technology. Some of the available communication technologies are ZigBee, wM-Bus, Z-Wave, Bluetooth, wireless, Wi-Fi, power line carrier communication and GPRS. They vary in their communication ranges and are suitable for different network sizes (in terms of the number of meters and nodes).

Need for analytics
Analytics help utilise the data collected by discoms through meters and other sensors and extract information, which can be used for a number of purposes in combination with other applications.
A key aim of deploying meter data analytics is to enhance power quality. The data can be analysed and help in quantifying losses, monitoring delivery voltages and outages, evaluating voltages and improving reactive power. Analytics can assist utilities in replacing reactive processes with proactive management and ensuring optimal system performance. In the area of condition monitoring, analytics can provide up-to-date load details; identify unanticipated load increases and overutilised, under-utilised and at-risk transformers and other assets; and assist in the evaluation of transformer sizing using loading history and peak seasonal loads.
Data analytics is also deployed for undertaking the forecasting and scheduling of renewable sources of power generation. It can be used for forecasting total consumer usage at the feeder or substation level; net usage for distributed generation like in the case of solar rooftops; and the usage of new technologies like plug-in electric vehicles. Analytics can even be deployed to estimate demand response availability at the facility level.
Analytics methodology
Discoms need to revamp the manner in which they carry out analytics. Ideally, the first step should be determining the objective of the exercise, followed by data collection. Determining specific data requirements will also provide discoms with information about the frequency and quantum of data that is required, whether there is a need for online or offline data, the communication method, and server capacity. Hence, data collection needs to be preceded by identifying the applications that a discom intends to deploy.
There are two ways of performing analytics in discoms: on the basis of domain knowledge or on the basis of scientific analytics. Each method has its advantages and disadvantages. Engineers prefer analytics based on domain knowledge, which makes an attempt to derive the logic between possible causes and symptoms. This method is effective and provides an immediate outcome, but its drawback is that the expertise is limited. Scientific analysis relates to pattern recognition, trend recognition, machine learning and artificial intelligence, and is generally used by IT companies and professional analysts. However, this technique requires massive amounts of historical data and software, and the output in the first three to four years is almost zero due to the absence of past records.
Summing up
To conclude, a host of technologies is available for undertaking meter data acquisition and for making data available to the utility system. However, it is critical to adopt a technology that is best suited to a particular region and is simultaneously robust, cost-effective, easy to understand, and scalable. It is also extremely important to ensure the integrity of meter data throughout the data acquisition process.
Further, to realise the full value of analytics, there is a need to integrate information from all other data sources as well. In the following years, discoms can also leverage cloud infrastructure as it can overcome the bottlenecks associated with traditional hardware and software systems.
Based on presentations by Rajesh Bansal, Senior Vice-President, BSES Rajdhani Power Limited; and Mitul Thapliyal, Senior Principal and Practice Leader, Energy Utilities and Smart Cities, Infosys