
")
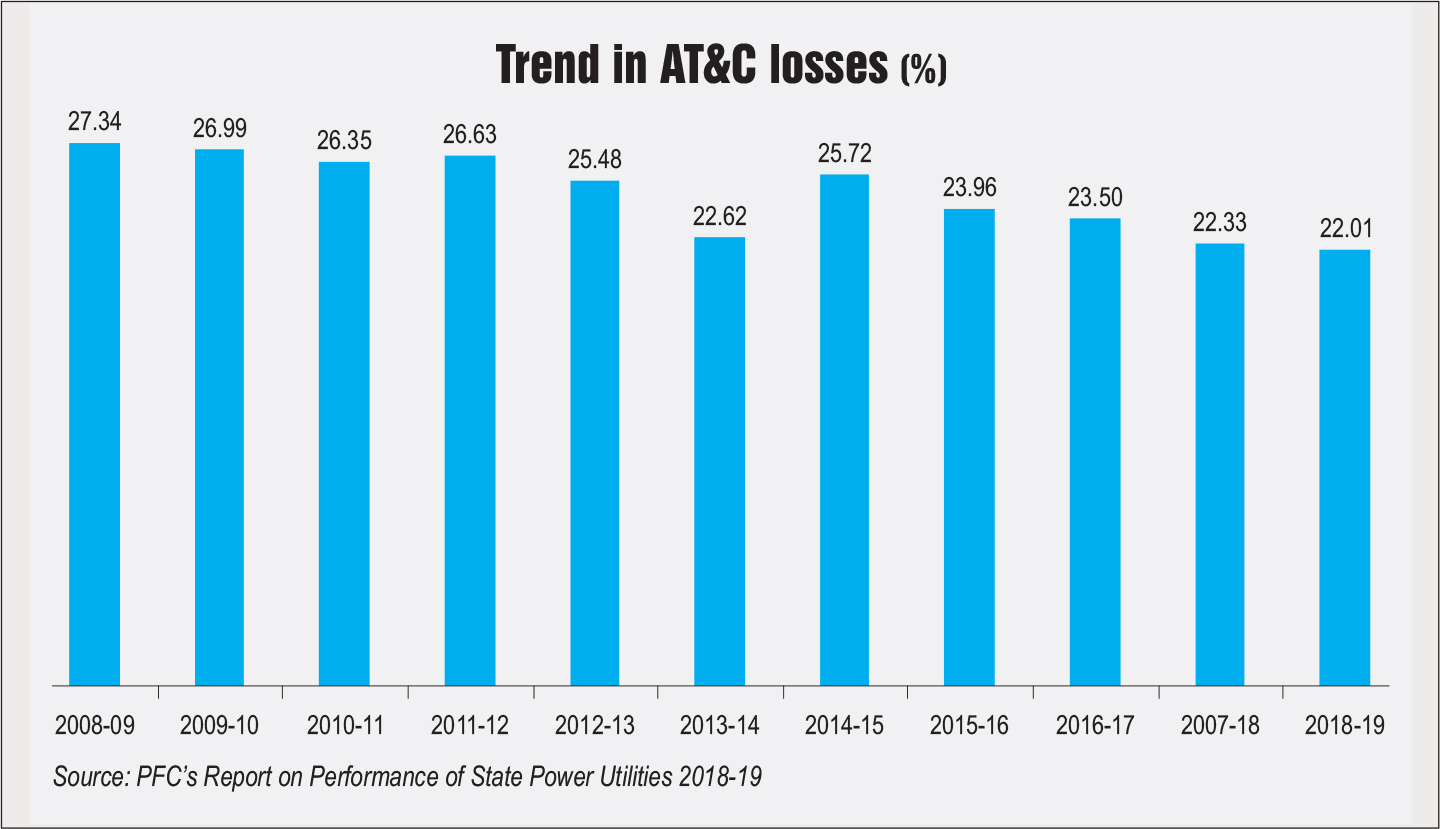
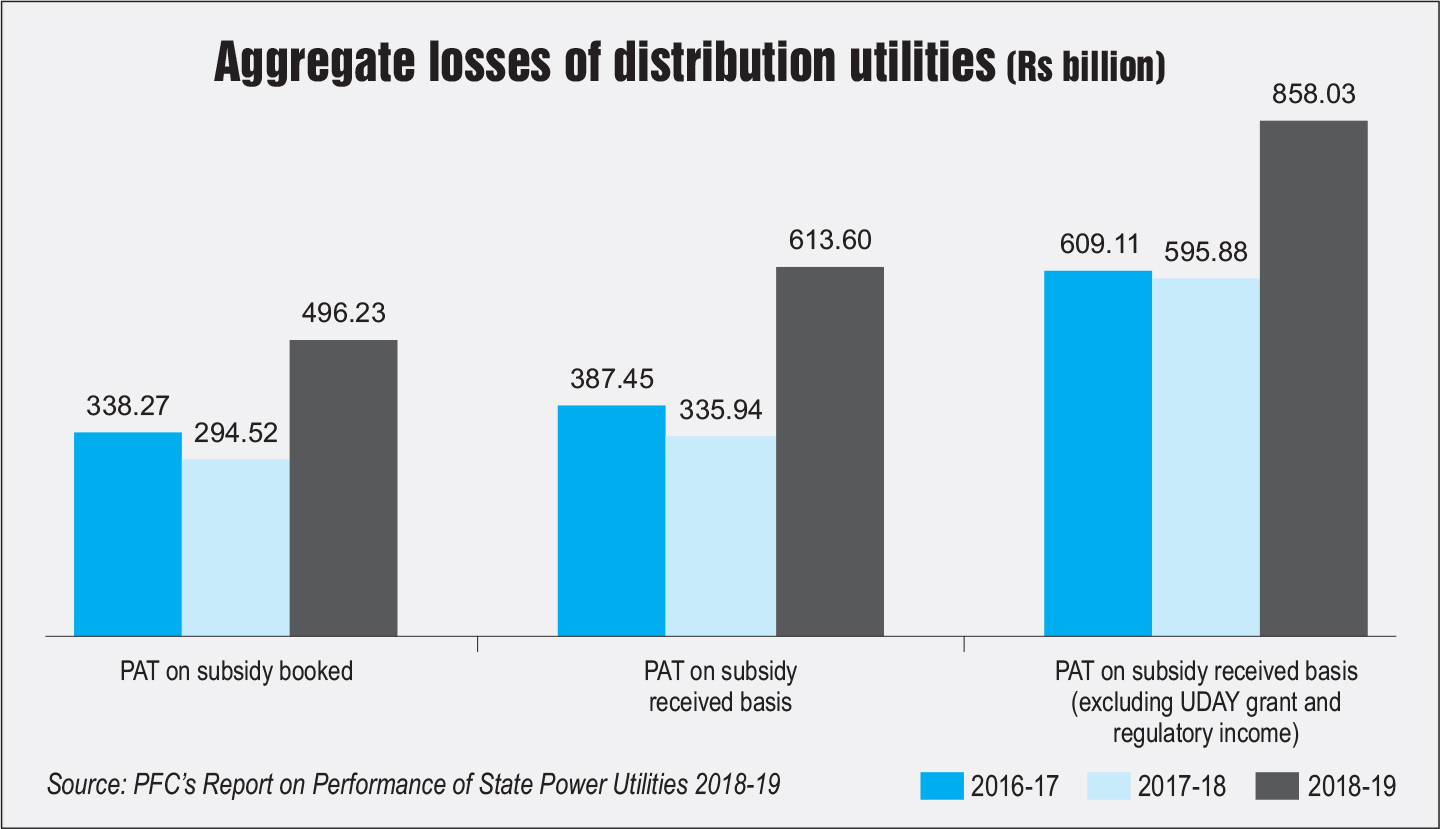
The financial and operational performance of state power utilities continues to be an area of concern for the power sector. The performance of power distribution utilities has been worrisome in particular, with mounting book losses, widening revenue gap, and high aggregate technical and commercial (AT&C) losses. The Power Finance Corporation (PFC) has released a report on the performance of state utilities in 2018-19. The report covers the performance of 104 power utilities (gencos, transcos and discoms, including power departments) during the period 2016-17 to 2018-19 with particular focus on the year 2018-19. The report notes that power distribution utilities recorded losses (audited) of Rs 496.23 billion in 2018-19 (on a subsidy booked basis), a decline of 68 per cent over the previous year. Besides, their AT&C losses were at a fairly high level of 22 per cent during 2018-19.
A look at the operational and financial performance of state power utilities…
Performance of distribution utilities
Energy sale: The gross energy sold by distribution utilities stood at 957.51 BUs in 2018-19, registering a year-on-year growth of 7.45 per cent. State-wise, Maharashtra accounted for the highest share in the gross energy sales at 11.65 per cent, followed by Uttar Pradesh at 9.2 per cent and Gujarat at 8.48 per cent. Consumer-wise, industrial consumers accounted for 29 per cent of the total sales, followed by domestic consumers (28.01 per cent), agricultural consumers (22.44 per cent) and commercial consumers (9 per cent).
Tariff subsidy booked and received: In 2018-19, the tariff subsidy booked by distribution utilities increased by 18.62 per cent to reach Rs 1,103.91 billion. The percentage of the tariff subsidy booked by utilities in the total revenue increased by 0.81 per cent to reach 16.39 per cent in 2018-19. Meanwhile, the tariff subsidy released by the state governments stood at 89.37 per cent in 2018-19, marking a decline of 6 percentage points over the previous year. All state/UT governments except Delhi (99 per cent), Telangana (82 per cent), Madhya Pradesh (81 per cent), Karnataka (76 per cent), Rajasthan (71 per cent), Chhattisgarh (60 per cent) and Andhra Pradesh (21 per cent) released the entire subsidy booked to their respective distribution utilities during 2018-19.
Total revenue and expenditure: The total revenue (including subsidy booked, regulatory income, revenue grants and other income) of distribution utilities increased by 12.8 per cent to stand at Rs 6,735.84 billion in 2018-19. Consumer category-wise, industrial consumers accounted for a 36.05 per cent share in the revenue generated from the sale of power, followed by domestic consumers (19.67 per cent), commercial consumers (13.33 per cent) and agricultural consumers (2.73 per cent). Meanwhile, the total expenditure of utilities increased by 15.35 per cent to stand at Rs 7,231.01 billion.
 Profitability: The aggregate losses for distribution utilities increased from Rs 294.52 billion in 2017-18 to Rs 496.23 billion in 2018-19, a decline of 68 per cent. Aggregate losses with subsidy increased from Rs 335.94 billion in 2017-18 to Rs 613.6 billion in 2018-19. In 2017-18, aggregate losses with subsidy received but excluding regulatory income and grant under the UjwalDiscom Assurance Yojana (UDAY) stood at Rs 595.88 billion. With regard to profit after tax (PAT) with subsidy, excluding UDAY grant and regulatory income, 11 states recorded an improvement in 2018-19 vis-à-vis 2017-18. Meanwhile, 20 states recorded a decline in PAT. During 2018-19, the highest PAT was recorded by Maharashtra (Rs 19.16 billion), followed by Delhi (Rs 7.14 billion) and Punjab (Rs 2.72 billion). Meanwhile, Tamil Nadu, Andhra Pradesh and Rajasthan were the worst performers with a negative PAT of Rs 179.62 billion, Rs 168.31 billion and Rs 125.24 billion respectively.
ACoS, ARR and revenue gap: The average cost of supply (ACoS) for distribution utilities increased by 8.75 per cent to reach Rs 6.09 per kWh in 2018-19. The average revenue with subsidy received increased by 5.09 per cent and stood at Rs 5.57 per kWh in 2018-19. The revenue gap with subsidy received increased from Re 0.30 per kWh in 2017-18 to Re 0.52 per kWh in 2018-19. Meanwhile, the revenue gap with subsidy received, excluding revenue grant under UDAY and regulatory income, increased from Re 0.53 per kWh to Re 0.72 per kWh.
In 2018-19, 19 states recorded a revenue gap/(surplus) less than the national average, while 12 states recorded a revenue gap/(surplus) higher than the national average. Arunachal Pradesh recorded the highest revenue gap of Rs 4.27 per kWh, followed by Nagaland (Rs 4.09 per kWh) and Andhra Pradesh (Rs 2.67 per kWh). On the other hand, Assam, Delhi and Maharashtra recorded a negative revenue gap of Re 0.32 per kWh, Re 0.23 per kWh and Re 0.19 per kWh respectively.
AT&C losses: The average AT&C losses for distribution utilities at the national level improved from 22.33 per cent in 2017-18 to 22.01 per cent in 2018-19. State-wise, during 2018-19, 14 states recorded AT&C losses of less than the national average, while 17 states had AT&C losses higher than the national average. Arunachal Pradesh recorded the highest AT&C losses at 55.5 per cent, followed by Jammu & Kashmir (49.94 per cent), and Nagaland (40.06 per cent). Meanwhile, Delhi recorded the lowest AT&C losses at 9.07 per cent, followed by Kerala (9.1 per cent) and Punjab (11.28 per cent). Besides, 17 states recorded an improvement in AT&C losses in 2018-19 vis-à-vis 2017-18, while 14 states recorded a deterioration in AT&C losses.
Billing efficiency improved from 82.69 per cent in 2017-18 to 83.42 per cent in 2018-19 while collection efficiency deteriorated from 93.93 per cent to 93.49 per cent during the same period.
Others: Receivables from the sale of power for distribution utilities increased by 15.12 per cent from Rs 1,587.29 billion as of March 31, 2018 to Rs 1,827.29 billion as of March 31, 2019. The receivable number of days for the sale of power increased from 130 days to 135 days. Meanwhile, payables for the purchase of power by distribution utilities increased by 31.91 per cent from Rs 1,720.96 billion as of March 31, 2018 to Rs 2,270.18 billion as of March 31, 2019. The payable number of days increased from 133 days to 150 days.
 Performance of generation utilities
Profitability: Generation utilities together incurred a profit of Rs 29.65 billion during the year 2018-19, as compared to a loss of Rs 8.61 billion in the previous year. Chhattisgarh State Power Generation Company Limited recorded the highest profit (Rs 6.72 billion) during 2018-19, followed by Haryana Power Generation Corporation Limited (Rs 6.58 billion) and Jammu and Kashmir State Power Development Corporation (Rs 4.06 billion). However, Maharashtra State Power Generation Company Limited reported the highest loss at Rs 3.34 billion in 2018-19, followed by Bihar State Power Generation Company Limited (Rs 2.99 billion) and Andhra Pradesh Power Generation Corporation Limited (Rs 1.35 billion).
Borrowings: The total genco borrowings increased from Rs 2,032.75 billion as of March 31, 2018 to Rs 2,189.66 billion as of March 31, 2019.
Trade receivables: The trade receivables for generation utilities increased from Rs 719.72 billion as of March 31, 2018 to Rs 847.7 billion as of March 31, 2019. The receivable number of days for the sale of power increased from 239 days as of March 31, 2018 to 256 days as of March 31, 2019.
Performance of transmission utilities
Profitability: Transmission utilities together incurred a profit of Rs 17.48 billion during 2018-19, as compared to a loss of Rs 15.49 billion in 2017-18. Delhi Transco Limited recorded the highest profit during the year (Rs 6.27 billion), followed by Maharashtra State Electricity Transmission Company Limited (Rs 5.13 billion) and Haryana VidyutPrasaran Nigam Limited (Rs 4.2 billion). On the other hand, Tamil Nadu Transmission Corporation Limited reported the highest loss at Rs 46.66 billion, followed by Uttar Pradesh Power Transmission Corporation Limited (Rs 3.91 billion) and Jharkhand UrjaSancharan Nigam Limited (Rs 3.58 billion).
Borrowings: The total borrowings by transmission utilities increased from Rs 1,008.9 billion as of March 31, 2018 to Rs 1,080.66 billion as of March 31, 2019.
Trade receivables: For transmission utilities, the trade receivables increased from Rs 227.24 billion as of March 31, 2018 to Rs 256.59 billion as of March 31, 2019. Receivables in days increased from 252 days to 267 days.
 Conclusion
While a number of government schemes and programmes have been implemented over the years to improve the overall well-being of power utilities, a lot still remains to be done, especially in the power distribution segment. UDAY failed to deliver the desired results as the operational and financial performance of discoms did not show any sustained improvement. As per the PRAAPTI portal, their poor performance has weighed down on the upstream segment, with overdues to gencos amounting to Rs 1,171.3 billion as of end May 2020.
That said, all hopes are pinned on the various government schemes and programmes in the offing. These include the Atal Distribution System Improvement Yojana, the privatisation of discoms, and the finalisation of the amendment to the Electricity Act, 2003.
Priyanka Kwatra