
The report covers 117 power utilities for the year 2020-21. The report is compiled based on audited/provisional annual accounts of the utilities. Of the 117 utilities, 98 have provided audited accounts and 8 have provided provisional accounts. For the remaining 11 utilities which are power departments and do not prepare annual accounts, information submitted by the utilities/information available in tariff petitions have been used.
The report analyses the performance of power utilities based on their segment of operation – distribution, generation, transmission and trading. For the purpose of analysis, GEDCOS, Integrated Utilities and Power Departments have been grouped with distribution utilities. State-wise aggregates of key parameters have also been included.
Performance of Distribution Utilities
- Despite the continuing operational challenges due to COVID-19, all the distribution companies covered in the report have submitted audited accounts for 2020-21. 20 states/ UTs have issued tariff orders for 2022-23 on time (by April 1, 2022). 25 states/ UTs have issued tariff order as on July 25, 2022.
- Gross energy sold by distribution utilities was 1,024,309 million units (MU) in 2019-20 and 1,005,044 MU in 2020-21 registering a year-on-year decrease of 1.88 per cent. Revenue from sale of power including tariff subsidy billed decreased by 1.76 per cent during the same period from Rs 6,438.81 billion in 2019-20 to Rs 6,325.43 billion in 2020-21.
- Aggregate losses for distribution utilities increased from Rs 302.03 billion in 2019-20 to Rs 502.81 billion in 2020-21. Aggregate losses on tariff subsidy received excluding regulatory income and revenue grant under UDAY for loan takeover increased from Rs 639.49 billion in 2019-20 to Rs 885 billion in 2020-21.
- Tariff subsidy billed by distribution utilities increased from Rs 1,208.28 billion in 2019-20 to Rs 1,324.16 billion in 2020-21. As a percentage of total revenue, tariff subsidy billed by the utilities increased from 16.52 per cent in 2019-20 to 18.53 per cent in 2020-21.
- Tariff subsidy released by state governments as a percentage of tariff subsidy billed by distribution utilities decreased from 95.08 per cent in 2019-20 to 84.54 per cent in 2020-21.
- Gap on tariff subsidy billed basis increased from Rs 0.24 per kWh in 2019-20 to Rs 0.41 per kWh in 2020-21. Gap on tariff subsidy received excluding regulatory income and revenue grant under UDAY for loan takeover increased from Rs 0.50 per kWh in 2019-20 to Rs 0.71 per kWh in 2020-21.
- Cash adjusted gap increased from Rs 0.83 per kWh in 2019-20 to Rs 0.95 per kWh in 2020- 21.
- Receivables for sale of power (no. of days) increased from 140 days sale as on March 31, 2020 to 161 days sale as on March 31, 2021.
- Payables for purchase of power (no. of days) increased from 164 days sale as on March 31, 2020 to 176 days sale as on March 31, 2021.
- Net worth continues to be negative at Rs 441.60 billion as on March 31, 2021.
- Total borrowings by distribution utilities increased from Rs 5,052.46 billion as on March 31, 2020 to Rs 5,861.94 billion as on March 31, 2021.
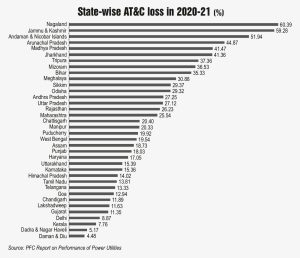
- Overall aggregate technical and commercial (AT&C) losses for distribution utilities deteriorated from 20.73 per cent in 2019-20 to 22.32 per cent in 2020-21.
 Performance of Generation Utilities
- Generation utilities earned a profit of Rs 27 billion in 2020-21, as compared to profit of Rs 38.36 billion in 2019-20. 16 out of 23 generation utilities registered profit in 2020-21.
- Net worth for generation utilities increased by Rs 45.46 billion from Rs 1,105.41 billion as on March 31, 2020 to Rs 1,150.87 billion as on March 31, 2021.
Performance of Transmission Utilities
- Transmission utilities earned a profit of Rs 9.55 billion in 2020-21 compared to a loss of Rs 2.87 billion in 2019-20. 15 out of 22 transmission utilities registered profit in 2020-21.
- Net worth for transmission utilities increased by Rs 71.11 billion from Rs 865.03 billion as on March 31, 2020 to Rs 936.14 billion as on March 31, 2021.
Performance of Trading Utilities
- Trading utilities earned a profit of Rs 160.91 billion in 2020-21 compared to a loss of Rs 43.96 billion in 2019-20. Uttar Pradesh Power Corporation Limited (UPPCL) incurred a profit of Rs 173.79 billion (mainly due to reversal of impairment in investment amounting to Rs 171.12 billion) in 2020-21 while Grid Corporation of Odisha Limited (GRIDCO) incurred a loss of Rs 13.82 billion.
- Net worth for trading utilities increased by Rs 268.23 billion from Rs 434.23 billion as on March 31, 2020 to Rs 702.46 billion as on March 31, 2021.