
Market monitors are crucial for continuously overseeing market activity, particularly in terms of predicting the possession of market power in the power market. This is because electricity cannot be stored economically at large volumes, and electricity demand is considered highly inelastic; therefore, electric power markets are highly susceptible to manipulation by suppliers. Market manipulation generally occurs in two forms – physical withholding, where generation capacity is removed from the market, thereby increasing prices; and economic withholding, where firms submit offers that are not reflective of marginal costs to drive up prices. Additionally, firms can influence market prices by exercising their market power.
Market power in power markets has been extensively examined through various structural approaches (which focus on firms’ market power) and market simulation/estimation approaches (which analyse market power at the industry level). Various models can be utilised for detecting market power, each with its strengths and weaknesses. Structural indicators such as the concentration ratio (CR), the Herfindahl-Hirschman Index (HHI), the Pivotal Supplier Index (PSI) and the Residual Supply Index (RSI) are commonly used to measure market power. The PSI and RSI are more effective measures as compared to standard concentration measures such as CR and HHI, which do not account for demand-side factors. Models such as the Lerner Index and residual demand analysis can be employed, but obtaining data for measures such as marginal costs, capacity and bid data for each firm may pose a challenging task.
An issue that has been gaining importance in recent economic literature on market power in the electricity market is the role of renewable energy sources. In fact, the price-cost markup in electricity markets tends to fall with the rise in wind or solar power generation. The general argument is that, for a given number of firms, the supply function of the electricity market flattens when renewable energy sources output is high compared to when it is low, primarily due to their low marginal cost. Thus, the increase in prices due to the strategic withholding of capacity by profit-maximising firms tends to be lower when renewable energy source output is high than when it is low.
According to the Central Electricity Authority reports, the gross electricity generation in India during 2022-23 stood at 1,624.47 BUs. Of the total electricity generation, 88 per cent was tied up in long-term bilateral contracts, while the remaining 12 per cent was transacted through various short-term segments (contracts for less than one year). This includes transactions through trading licensees, power exchanges, direct agreements between distribution companies, and the deviation settlement mechanism. Approximately 6.34 per cent of the total electricity generation was transacted through the day-ahead market (DAM), term-ahead market and real-time market (RTM) of the power exchanges. At present, there are three power exchanges in India –Indian Energy Exchange Limited (IEX), Power Exchange India Limited (PXIL) and Hindustan Power Exchange Limited (HPX). The IEX, PXIL and HPX began operations in June 2008, October 2008 and July 2022 respectively. The DAM also commenced in 2008, while the RTM started in 2020.
As previously mentioned, there is a possibility for market power in power markets; therefore, it is crucial to examine this issue in the Indian context. The objective of this paper is to provide empirical evidence on the extent of market power and the level of competition in the DAM and RTM. This paper is structured as follows: Section I presents the data and methodology, Section II provides an empirical analysis of the concentration of market power in the DAM and RTM, and Section III concludes the results of the empirical analysis.

I. Data and methodology
Although it is ideal to use the data for each hour/time block, to meet objectives at the macro level, one can use annual data for analysing market power concentration. In this regard, annual data on all sellers and their volumes of electricity transactions through the DAM and RTM of power exchanges have been considered for the period from 2009-10 to 2022-23. Due to limitations in data availability/limited data, the paper does not include an analysis of PXIL’s RTM and HPX’s DAM and RTM.
Various models can be used for measuring market power. However, this paper only covers commonly used concentration measures such as CR and HHI. The CR is a ratio that indicates the size of firms in relation to their industry as a whole. A low CR indicates greater competition among firms within that industry. The HHI is an alternative indicator of firm size, calculated by squaring the percentage share of each firm in an industry and then summing these squared market shares to derive an HHI. HHI can be considered a better measure of market concentration because it gives more weight to larger firms. An increase in the HHI generally indicates a decrease in competition and an increase in market power, and vice versa. The CR (CR4 and CR8 in the Table 1 represent the four and eight largest firms in the market, respectively) and HHI has been used to predict the possession of market power in the DAM and RTM of power exchanges.
II. Concentration of market power in DAM and RTM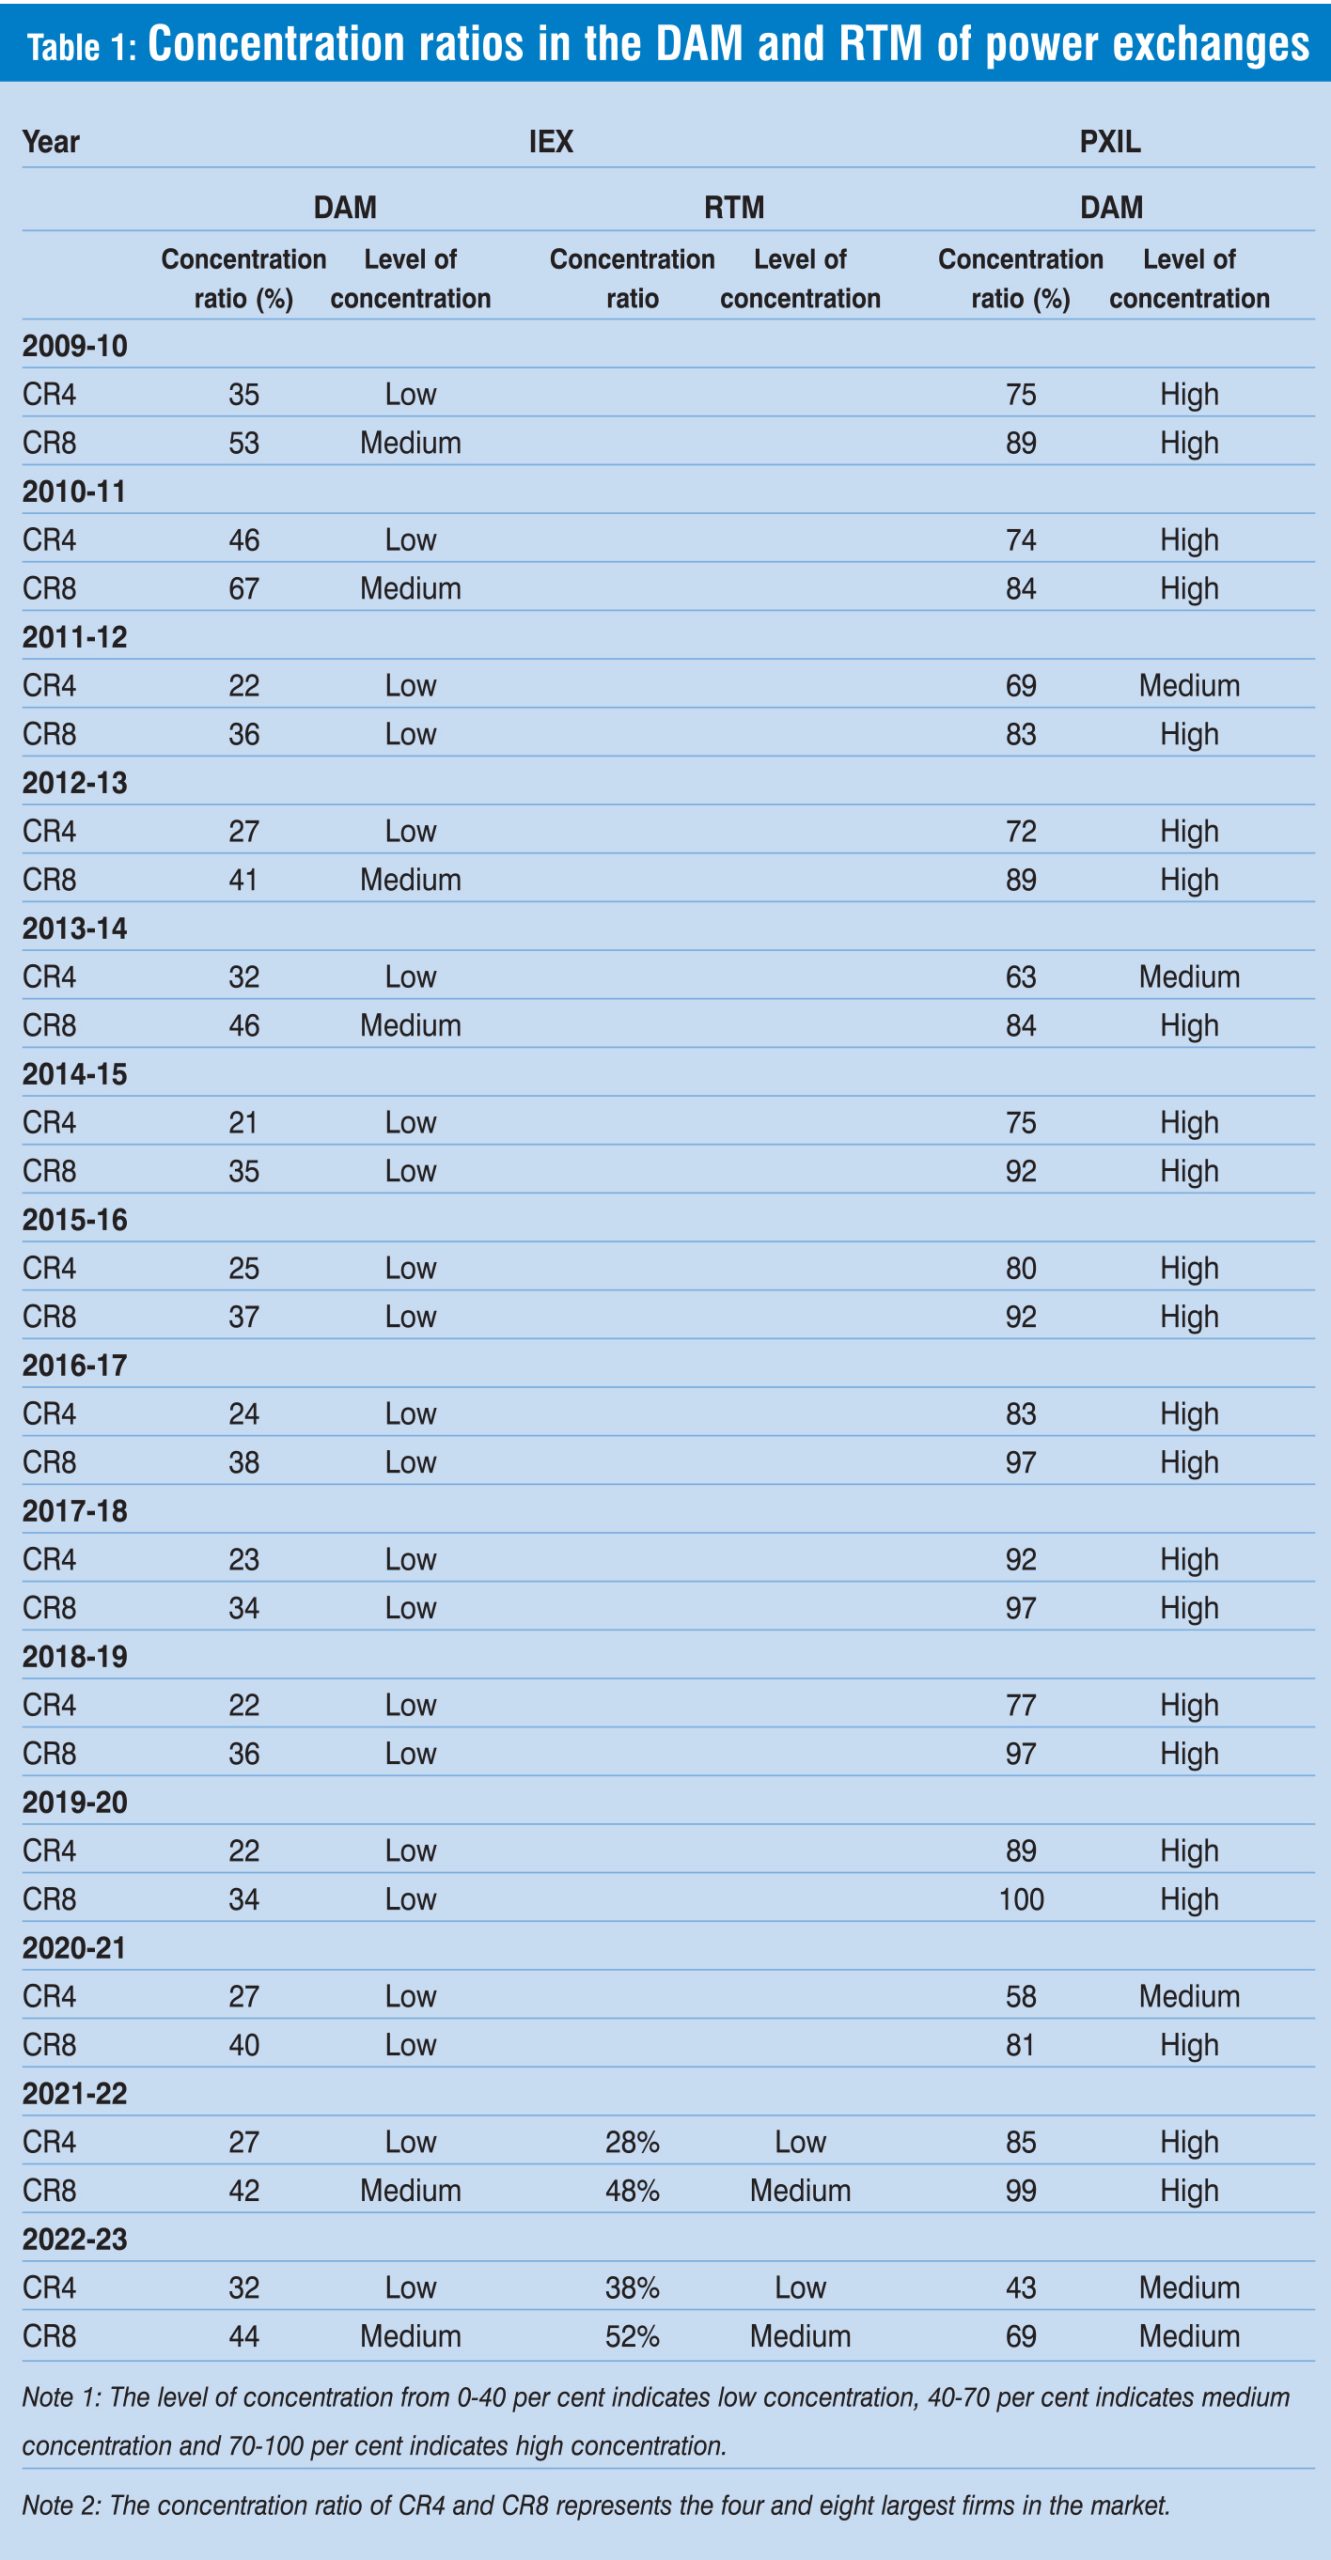
The volume of electricity transacted in the IEX’s DAM increased from 6.17 BUs in 2009-10 to 51.18 BUs in 2022-23. Similarly, the number of sellers increased from 159 to 379 during this period. An opposite trend can be observed in PXIL’s case. The volume of electricity transacted in PXIL’s DAM declined from 0.92 BUs in 2009-10 to 0.19 BUs in 2022-23. The number of sellers also declined from 38 to 31 during this period. The volume of electricity transacted in the IEX’s RTM increased from 19.91 BUs in 2021-22 to 24.17 BUs in 2022-23. The number of sellers also increased from 331 to 386 during this period.
By utilising the data on sellers and the volume of electricity transacted by them, the CRs of the four (CR4) and eight (CR8) largest firms have been computed for the DAM and RTM of power exchanges for the period from 2009-10 to 2022-23. The CRs and the corresponding concentration levels have been provided in Table 1. The table shows that in the DAM of the IEX, the concentration level for CR4 was low throughout the 14 years of the study period. In the case of CR8, the concentration level was low in eight years and medium in six years. Further, in the DAM of PXIL, the concentration level for CR4 was medium in four years and high in 10 years. In the case of CR8, the concentration level was medium in one year and high in 13 years. In the RTM of the IEX, the concentration level was low for CR4 and medium for CR8 during the study period.
Utilising the data on sellers and the volume of electricity transacted by them, the HHI has been computed for the DAM and RTM of power exchanges for the period from 2009-10 to 2022-23. The HHI and the level of concentration are provided in Table 2. The table shows that in both the DAM and RTM of IEX, the HHI was <0.15, indicating an unconcentrated market. In the DAM of PXIL, the HHI was <0.15 in two years, which indicates unconcentrated; >0.15 in five years, which indicates that the concentration was moderate; and >0.25 in seven years, which indicates that the concentration was high. It can be concluded that the level of concentration was low/unconcentrated, indicating high competition among sellers in both the DAM and RAM of IEX during the study period. The level of competition was relatively low in the DAM of PXIL as compared to the DAM of the IEX, primarily due to low liquidity and limited participation in the market.
The concentration of market power in the DAM and RTM of both power exchanges is shown in the accompanying graphs, indicating trends in the level of concentration over the given period. Figure 1 shows the concentration of market power in the DAM and RTM of the IEX, while Figure 2 shows the concentration of market power in PXIL’s DAM. Figure 1 shows a declining trend in HHI from 2009-10 to 2019-20, indicating an increase in competition. During the past three years, while there has been an increasing trend in HHI, the level of concentration indicates high competition in the markets.
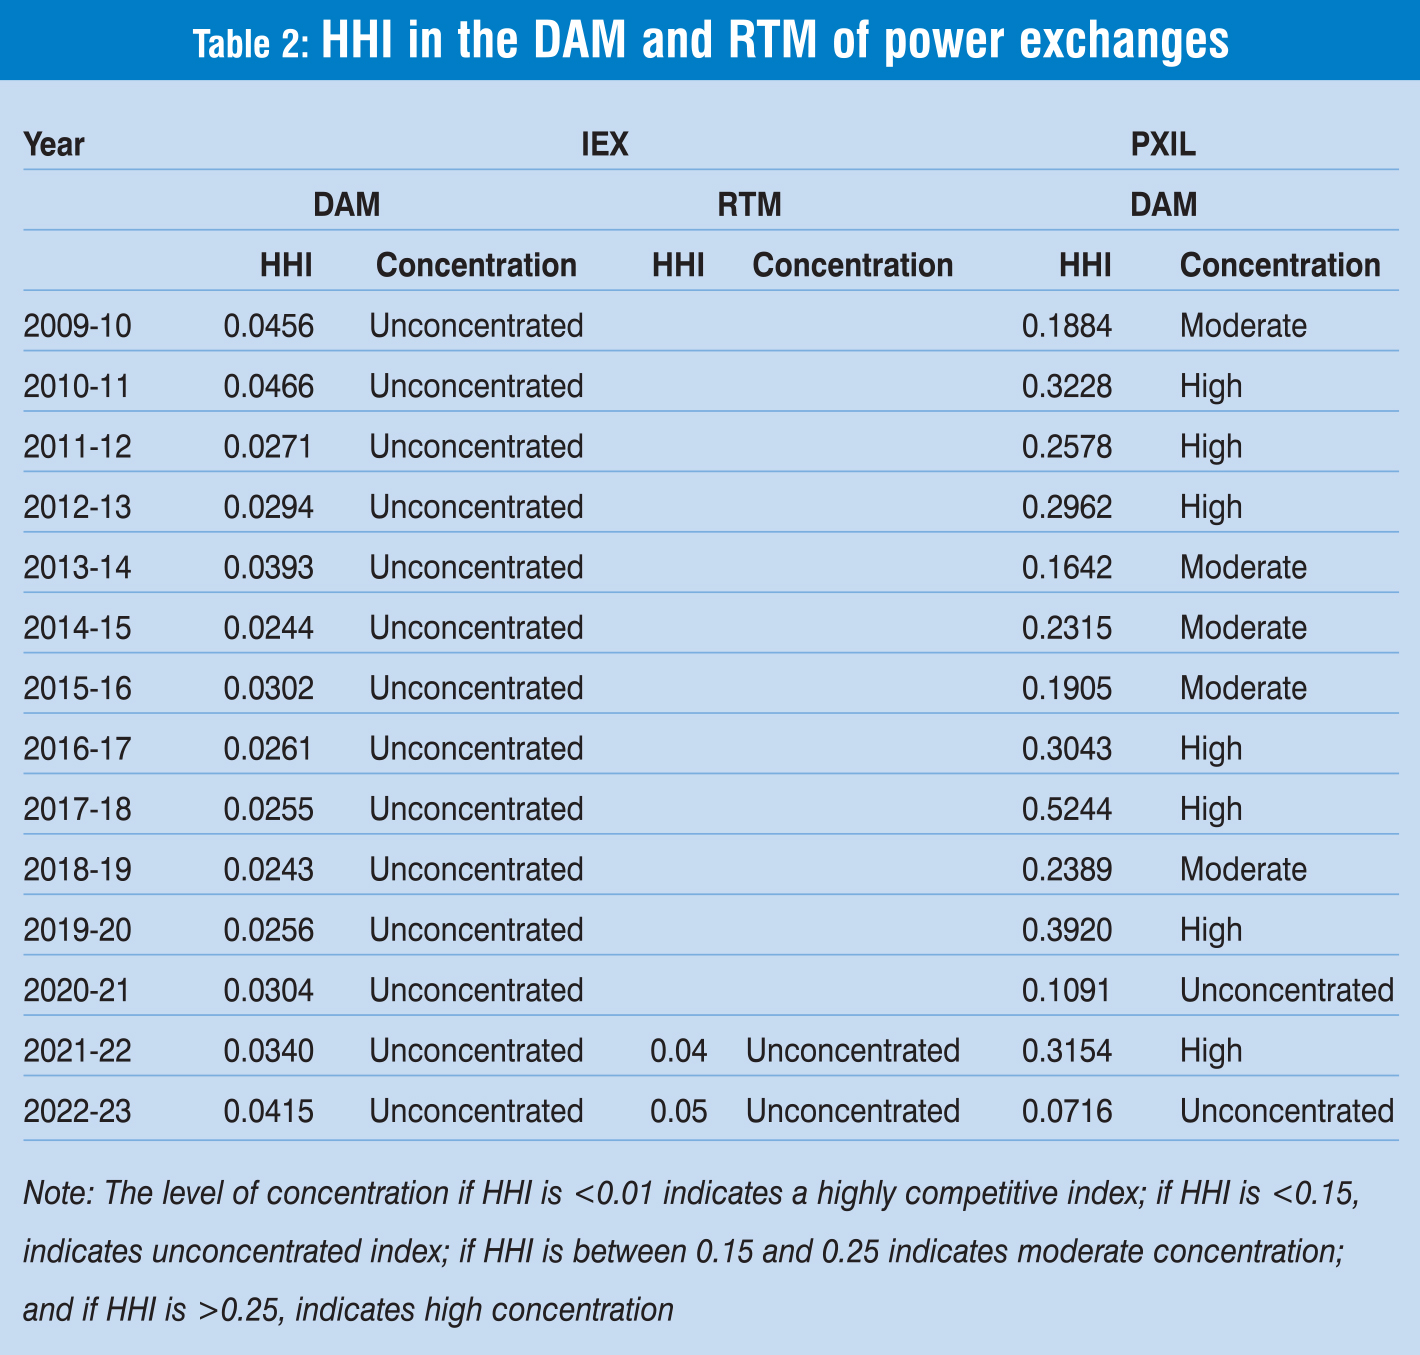 Figure 2 shows that the HHI trend was range-bound during 2009-10 to 2016-17, and thereafter it became zigzag and declined during 2017-18 to 2022-23. This was mainly due to limited participation and low liquidity in the market.
III. Conclusion
- The empirical evidence shows that in the DAM and RTM of the IEX, the concentration level was low/unconcentrated, indicating high competition among sellers in both markets during the entire study period. In the DAM of PXIL, the concentration level was medium to high, indicating moderate to low competition among sellers in the market.
- The level of competition in the DAM of PXIL was relatively low compared to the DAM of the IEX, primarily due to low liquidity and limited participation in the market.
- The high competition among sellers should have resulted in lower prices and higher consumer welfare.


