
")
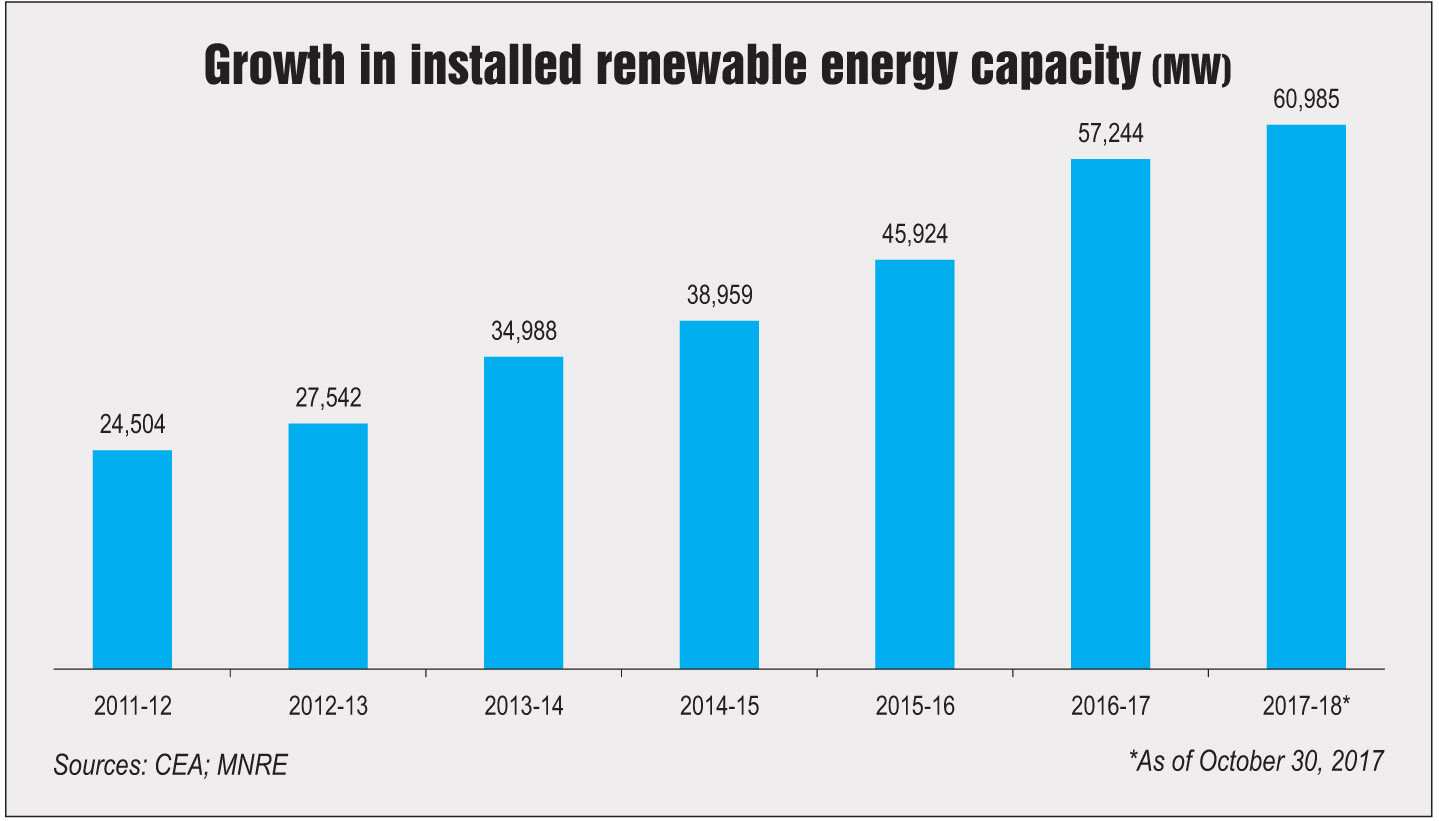
The renewable energy segment presents an attractive investment opportunity in the power sector with record capacity additions, declining tariffs and growing private sector participation. In 2016-17, 11.3 GW of renewable capacity was added, comparable with thermal capacity additions of 11.5 GW during the year. As of end-October 2017, the installed renewable energy capacity stood at over 60 GW, accounting for 18 per cent of the total installed power capacity.
Further, in the latest auctions, solar and wind tariffs have fallen to Rs 2.44 per unit and Rs 2.43 per unit respectively, considerably lower than the average cost of NTPC’S coal-based power at Rs 3.18 per unit for 2016-17. In terms of generation, however, the renewable industry’s share remains small owing to the low capacity utilisation factor of renewable energy plants. In 2016-17, around 82 BUs of renewable energy was generated, constituting 6.6 per cent of the total generation (1,242 BUs) in the country.
Growth drivers
Ambitious capacity addition targets and a favourable policy framework have catapulted the growth of renewable energy in the country. In addition, technology advances, declining capital costs and increasing cost competitiveness have increased renewable capacity addition significantly in recent years. In 2014, the central government announced its target of 175 GW of renewable energy capacity by 2022, comprising 100 GW of solar, 60 GW of wind, 10 GW of bioenergy and 5 GW of small-hydro power (SHP). While the targets seemed quite ambitious at first, the government is now confident of achieving them comfortably.
In terms of capacity, solar recorded an impressive compound annual growth rate of over 54 per cent, from just about 1.7 GW in 2012 to 14.75 GW in 2017 as of end-October 2017. The growth has been driven by declining photovoltaic module prices, strong competition, sliding solar power tariffs and declining cost of capital with the availability of low-interest funds. Over the past year, one of the key developments in the solar segment has been the exponential decline in tariffs. The latest low of Rs 2.44 per kWh, recorded in the auction held in May 2017 for 500 MW of capacity at the Bhadla Solar Park in Rajasthan, is a sharp decline from the solar tariffs prevailing a year or two ago at Rs 5-6 per kWh.
The wind power capacity has also shown a significant growth, doubling from about 16.18 GW in January 2012 to 32.72 GW in October 2017. The accelerated depreciation benefit and generation-based incentives played a key role in its expansion. However, the former is being phased out and the latter has been discontinued with effect from April 1, 2017. In addition, the government has shifted from the feed-in tariff (FiT) regime to competitive bidding for wind power projects and guidelines for the same have been issued. Subsequently, wind power tariffs have fallen to a record low of Rs 2.43 per kWh (Gujarat’s first wind auction held in December 2017) as against the average state-determined tariff of Rs 4-5 per kWh under the FiT regime. As a result, many states have decided to revise or dishonour the power purchase agreements (PPAs) signed with developers at the previously determined tariff citing the poor financial health of the discoms. This has impacted wind power capacity addition in 2017-18, which stood at 435.6 MW against the annual target of 4 GW. Meanwhile, the installed capacity of other renewable energy sources like biopower (including waste to energy) and SHP stood at 8,299 MW and 4,399 MW respectively. Despite their huge potential in the country, the segments have recorded sluggish growth.
Renewable energy for industrial and commercial consumers
Captive power projects (CPPs) based on renewable energy help industrial consumers avoid high grid power tariffs and load shedding undertaken by state discoms. Traditionally, bagasse- and wind-based projects have been the preferred choice for industrial consumers to meet their captive power requirements. Of the installed captive power capacity of over 63 GW tracked by India Infrastructure Research, bagasse-based CPPs accounted for an 11 per cent while wind-based CPPs accounted for 7.7 per cent as based March 2017.
The textile industry is mainly concentrated in the wind-rich states of Tamil Nadu, Maharashtra and Gujarat, and thus a large number of wind-based CPPs are present in these states. Meanwhile, bagasse-based units are mostly concentrated in Uttar Pradesh and Karnataka as the sugar industry, which generates bagasse (the sugarcane residue obtained from the sugar manufacturing process), largely operates in these states.
Of late, many industrial and commercial consumers have been shifting to rooftop solar solutions to meet their power requirements owing to falling capital cost of equipment and the introduction of net metering policies by states. As of March 2017, the total rooftop solar capacity in the country stood at 1.3 GW, of which about 42 per cent or 590 MW has been installed in the industrial consumer segment, 22.4 per cent or 313 MW in the commercial segment, 21.7 per cent or 303 MW in the residential segment, and the remaining on government buildings. About 1.5 GW is expected to be added in 2017-18.
The Ministry of New and Renewable Energy (MNRE) has recently released a proposal to amend the existing rooftop solar implementation mechanism. As per the proposal, the discoms would be responsible for the implementation of rooftop solar and they would be eligible to receive a financial assistance of up to Rs 234.5 billion depending on their performance. The discoms will receive incentives for each megawatt of rooftop solar capacity added and these installations would be counted as part of their renewable purchase obligations (RPOs).
 Issues and challenges
The lack of monitoring mechanisms in state discoms to check RPO compliance is a key challenge in the sector. In 2016-17, India missed its overall RPO target – as against a targeted non-solar renewable energy procurement of 8.75 per cent, the actual procurement was 5.51 per cent; and as against a solar RPO target of 2.75 per cent, the actual procurement was just 1.11 per cent.
In addition, the recent trend of discoms backing out on PPAs or renegotiating tariffs is a key concern for developers as it may result in significant renewable capacity and investment being stranded. Although the MNRE and Ministry of Power have time and again reiterated that the sanctity of the PPAs needs to be honoured, concrete steps in this regard are yet to be taken.
Outlook
The MNRE has recently released the roadmap to meet the wind and solar power targets by 2022. As per the roadmap, for achieving the 100 GW solar power target by 2022, the MNRE along with the states, would invite bids for 20 GW of ground-mounted solar capacity in 2017-18, of which 3.6 GW has already been bid out, 3 GW will be bid out in December 2017, 3 GW in January 2018, 5 GW in February 2018 and 6 GW in March 2018. About 30 GW will be bid out in 2018-19 and 30 GW in 2019-20.
In the wind power segment, the central government, along with the state governments, is planning to issue bids aggregating 8 GW this year. Of this, 5 GW has already been bid out, 1,500-2,000 MW will be bid out in January 2018 and 1,500-2,000 MW in March 2018. A total of 10 GW will be bid out in 2018-19 and 10 GW in 2019-20. Net net, the outlook for the renewable energy segment remains positive.

