

The adoption of digital technologies allows devices across the grid to communicate, and provides the information/data useful for customers, grid management and complex operations. The development of a smart electrical grid requires the installation of digital grid devices capable of handling digital information. The location of connectivity is an important and mandatory aspect. Many power utilities in the country do not have access to accurate data/information of the network assets. The asset details available are partially digitised and are not updated on a regular basis making it redundant. The complete digitalisation of the electrical network requires specially designed GPS receivers (Rovers), a base station and GIS software. These are proprietary products of the selected vendors. Due to their obvious vulnerability, they cannot be adopted to handle the large-scale data requirements. Also, it is difficult to develop and manage the widespread electrical network of government utilities, which involves multiple integrations, amendments and changes.
Limitations of prevailing practices and technology needs
The geographic information system (GIS) has emerged as a powerful tool for the development of geo-referenced consumer and network maps for power distribution utilities. GIS is often considered for the planning function while asset management is considered for the engineering and/or maintenance function. Many GIS software and traditional asset management programs (primarily asset-class specific tools) have complex system architectures. Therefore, integration and interfaces between them can be very complicated.
It has been reported that many discoms created GIS networks for cities/towns with the support of a private partner or an outsourcing option under various schemes. The biggest problem that electricity utilities are facing is the storage of historical data and real-time addition or alteration in the network at the field level. Besides, the software is an intellectual property and its needs regular support from its vendor for its updation. There are also limitations with regard to the integration of software with the existing ERP, billing, and SCADA systems, etc. Discoms need highly skilled and specialised manpower and special devices for regular updation of the electrical network. It is also difficult to update the base map to run various applications.
 At present, the utility has limited area-wise GIS data and still, a major part of the network is not digitally mapped and no location-based information of the assets and the network components is available. This entails random analysis and improper, erroneous results. Further, the inappropriate lay of the network result in misleading calculations and organisational alignment, making it difficult to coordinate.
In order to meet the prime requirement of electrical network digitalisation, specifically for state utilities, an innovative “GeoUrja” platform with a topology analysis method is developed as a power distribution network model. The connection between electrical equipment can be generated automatically according to the terminal position of the equipment primitives. It is a cross-platform and open-source desktop application framework and the topology data is organised and modelled. This will extend the range of asset information, data modelling, integration and provide analytics for supporting better management decision system and customer services.
GeoUrja
GeoUrja is a user friendly software platform developed for GPS survey of the existing electrical network and consumers by using a smart mobile device. The software-based application captures essential network elements such as the geographical position of electrical asstes such as transformers, HT and LT poles and lines, cable route and switching devices. The application also allows dynamic updatation, addition and modification of the power distribution system. GeoUrja is developed through an open-source platform and uses GIS cloud technology to help the utilities manage relevant information about customers, and the Distribution and Transmission network, providing an perfect overview of the entire system on a map. The digital view of the electrical asset and consumers over the land base map is helpful for managing and planning large areas covered by utilities.
Applications of GeoUrja
Under the GeoUrja platform, various applications are independently developed by the Gujarat Power Research & Development Cell, GUVNL, Gujarat. The key modules and developments are:
Easy survey mobile application
It is designed for electrical network line drawing methods with geo tagging to achieve maximum efficiency in time and accuracy by using a smart Android mobile device. The GPS data will be plotted by geo-referencing the area for the design and preparation of the overhead and underground network system. Every feature (locations, attributes, etc.) has to be incorporated accurately with the network.
The position of electrical poles, transformers, switching devices, cable route points, etc. will be marked on the drawing as shown in Figure 1. According to the characteristics of electrical equipment, in a transmission/distribution network, the equipment primitive is designed to meet the requirements of power utilities with relevant symbols. These symbols use different colours, line types, line widths, etc. to represent the different scenarios and component types.
The mobile application has an additional functionality to utilise the point buffer analysis function of the GIS development platform by traversing the bus objects and terminal objects as listed under:
- Network information with the HT and LT network over the satellite image.
- Consumer basic detail
- Quick search and navigation option for consumer and electrical assets
- Current location base overhead/underground network information
- Asset QR tagging and information
- Live location base network view
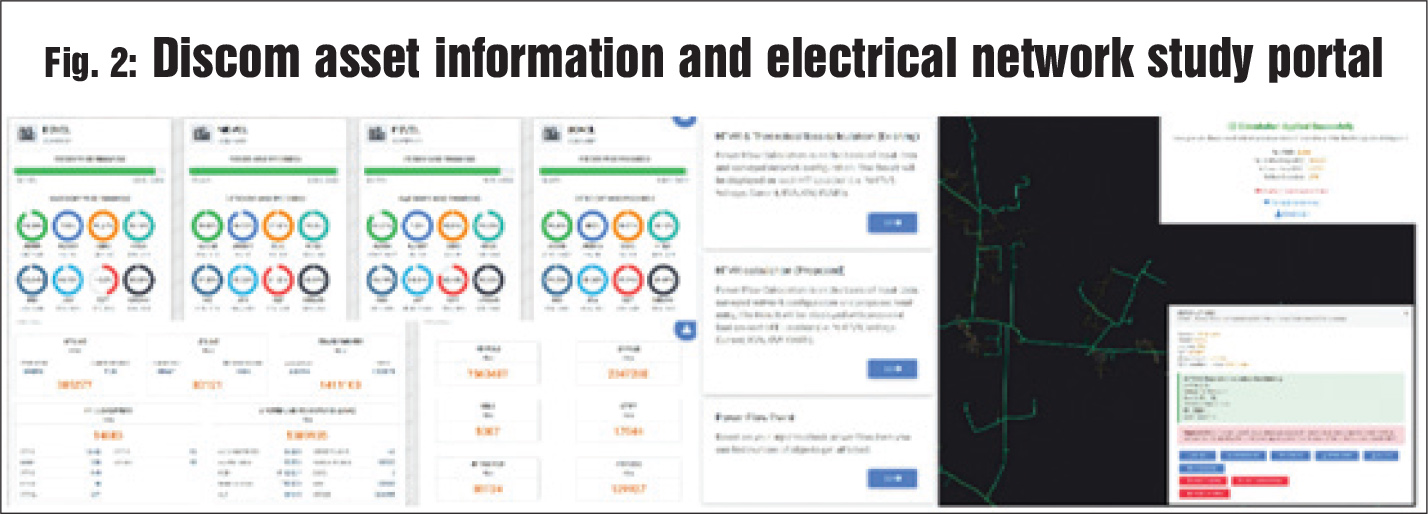
 Discom dashboard
Looking to the requirements and informational needs of utilities, the discom dashboard is designed in such a manner that the users can easily access the complete network data related to their surveyed feeders with the facility of several view formats. It provides users role-wise statistical information, feeder GPS surveyed data with attribute information, rich vector-based maps and geographical map of the feeders. Various reports and network maps can be generated and exported as per the user requirement. The key features of the dashboard are as follows:
- Electrical network statistical information
- Network asset attribute view and edit functionality
- Consumer details and coding
- Geographical and vector-based map
- Electrical network analysis with power flow study like voltage regulation, loss calculation, low voltage and reactive energy.
- Network planning with multiple network view over the geographical view
- Asset QR code tagging
- Integration with the ERP and billing systems through API services
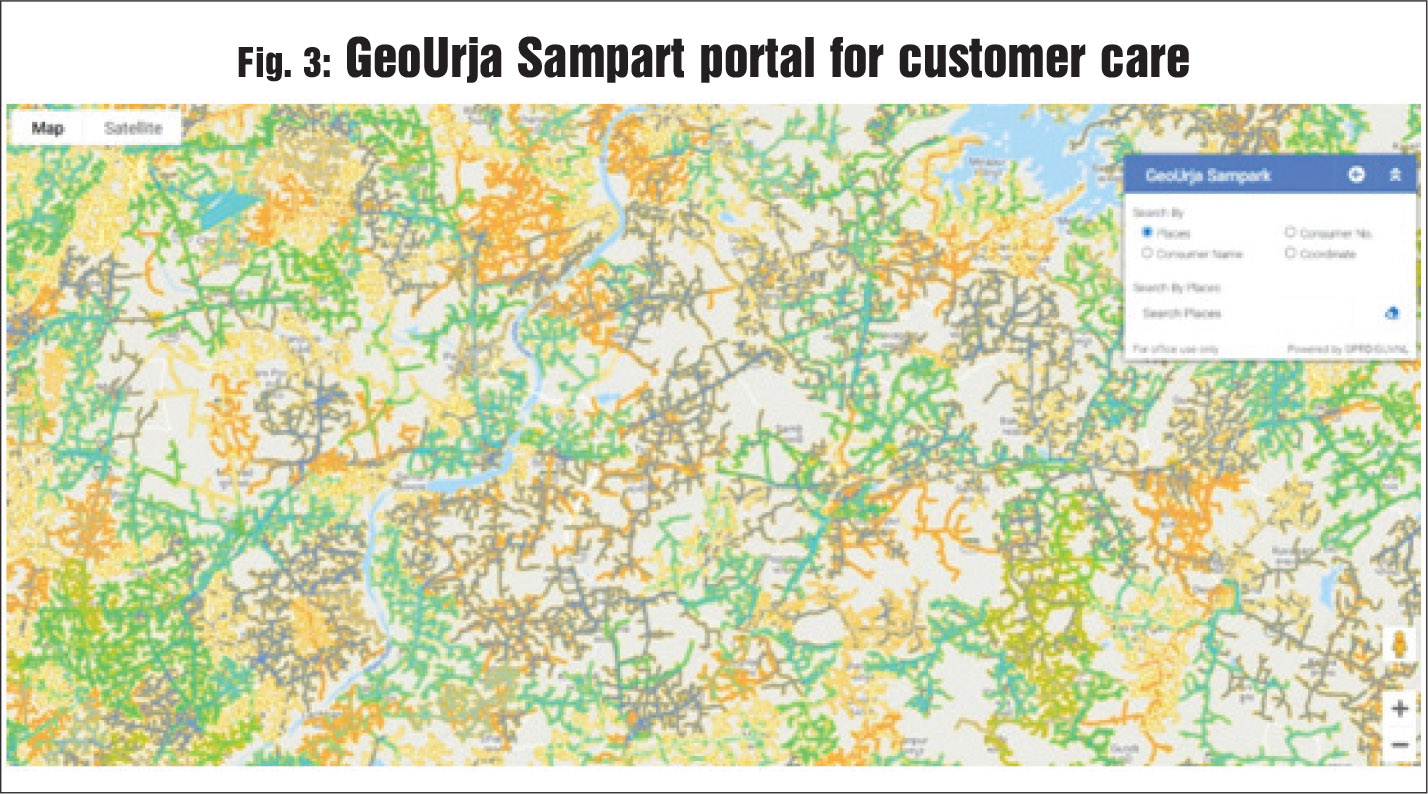
Sampark
The GeoUrja Sampark module is designed for the customer care centre. It is an integrated platform that provides the place and location information isused from the API of the geographical map. GeoUrja provides details of the consumer with electrical asset details and network connectivity. There is a search facility to get information regarding consumer name, place, number and geo-coordinates, etc., keeping the consumers informed about scheduled power outages.
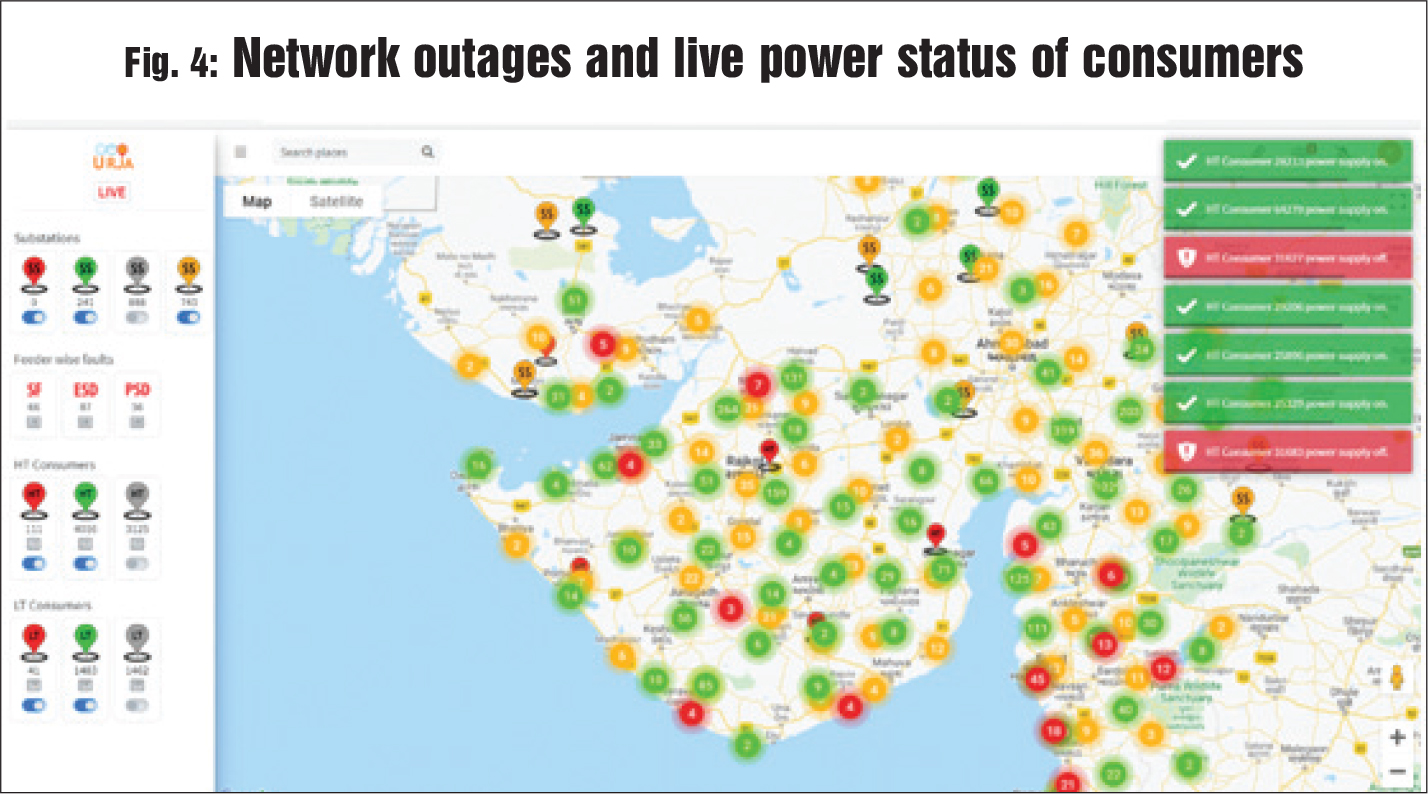
GeoUrja live
The unique and innovative dashboard is designed to know the live power supply status of feeders and consumers. The information of feeder circuit breakers, RMUs, meter modems, switches, etc. is carried out and plotted on a single platform with the GIS power network. The real-time power supply status of the consumers and ongoing network outage information helps access the power reliability and manage the power flow of the network.
Strategic ability
At the time of development and implementation of the GeoUrja project, the GPRD Cell has received many useful responses, ideas and suggestions from users that is, different authorities (engineers and employees ) of discoms, GETCO and GSECL. This has helped in making the GeoUrja platform very user-friendly and a low-cost application. Now, it can be said that GeoUrja as a platform demonstrated as a tool for enterprise functioning in the power sector. It provides the real-time and historical information of the energy data. The GPRD team is continuously working on further improving the GeoUrja platform by developing additional features based on suggestions received from the end users to make the application user-friendly, and reduce the toil of utilities. The vigorous brainstorming has resulted in better services.
Field study report under the GeoUrja platform
In a short span of two years, more than 20 million locations are geo-tagged with the Easy Survey Mobile application. Currently, GeoUrja manages the data of 472,081 ckt. Km of electric lines with 1,416,210 distribution transformers. There are more than 5.59 million consumers who are mapped. With the support of distribution utilities, more than 10,000 locations are being digitised on this GeoUrja platform every day.
Conclusion
The enterprise solution GeoUrja platform is aimed to cover the complete asset information, data modelling, integration and analysis for providing a supportive system for better management decision and improvised consumer services. The basic idea of GeoUrja is to make it a more beneficial database in comparison to other available alternatives. GeoUrja is a user friendly and low-cost application in comparison to other options for gathering different databases and analytical tools. It enables the automation of many functions of discoms. It is the pride of the Gujarat energy sector and a milestone that no other entity in the power sector has been able to achieve.
 By Rohit Patel, Executive Engineer (R&D), GPRD, GUVNL


